

Planetary and Respiratory Health: what citizen-reported data reveals about air pollution and disease
Drawing on 1,586 citizen-reported health profiles across 32 countries, LovexAir Foundation’s CheckAir Initiative delivers some of the first large-scale, real-world evidence linking respiratory symptoms and mental health burdens directly to local air quality data.
As climate change and urbanisation intensify air quality risks, this kind of citizen-generated, digitally-integrated evidence is essential for building the proactive, equitable health systems that Planetary Health demands.
By Lovexair Foundation
Article also featured on Planetary Health Alliance
When the air we breathe becomes a health emergency
Air pollution represents one of the greatest Planetary Health challenges worldwide.
The World Health Organization (WHO) reports that an estimated 8 million premature deaths are associated with exposure to air pollutants, particularly fine particulate matter (PM2.5), linked to an increased risk of respiratory, cardiovascular diseases and mental health conditions. In fact, 99% of the world’s population breathes air that exceeds the WHO recommendations [1]. These figures highlight the urgent need for scalable, data-driven approaches to better understand exposure and its health impacts across populations.
In this context, the Lovexair Foundation, a non-governmental organization focused on respiratory health, co-developed CheckAir within its digital ecosystem HappyAir. CheckAir is a scalable, digital health assessment tool that integrates self-reported health data and perceived risk factors from citizens with open-source air quality data provided by OpenAQ, enabling the identification of health risks associated with environmental exposure at both individual and population levels.
However, individuals exposed to high levels of air pollution, particularly those without a prior diagnosis or with limited access to healthcare, are often understudied. Addressing this gap is critical to target interventions for high-risk populations at both the individual and population level.
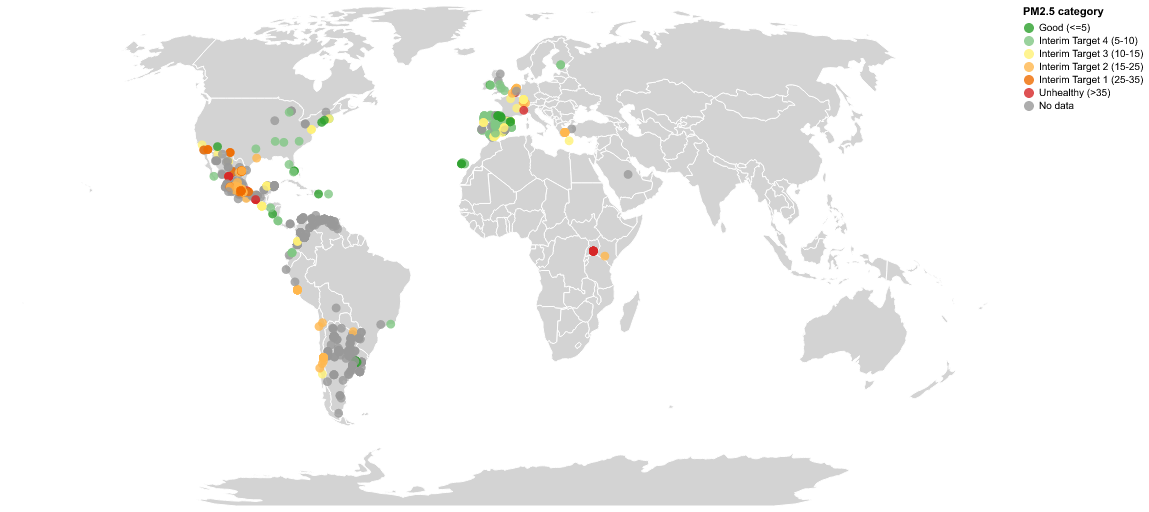
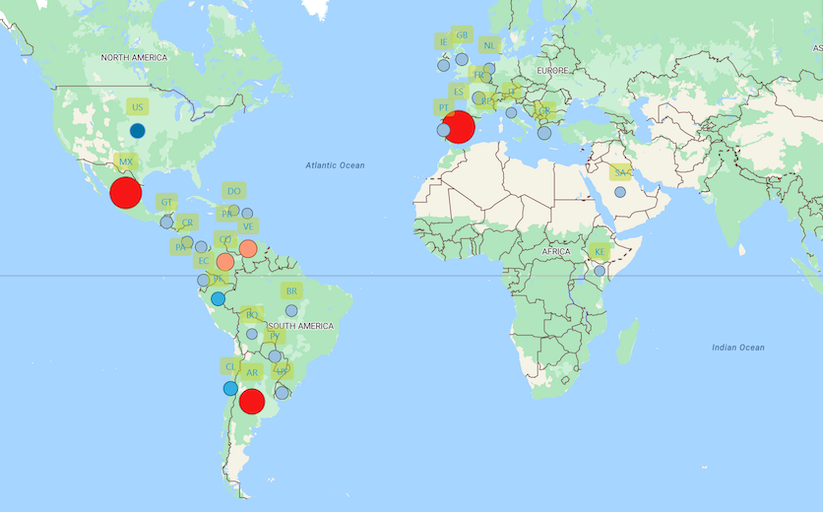
Figure 1 – Global Respiratory Health Map
This need aligns with the 2025 resolutions of the World Health Assembly (WHA), the WHO’s decision-making body, which call on Member States to address air pollution as a major public health risk and to strengthen prevention, surveillance and data-driven policy action. In this framework, CheckAir provides actionable insights that can inform public policies and guide clinical, public health and environmental interventions, particularly for populations at higher risk of disease onset or worsening health conditions.
From a Planetary Health perspective, this approach opens new opportunities for exposome research where environmental exposures can be monitored together with the real-world health and wellbeing experience of each citizen, in a global context.
Planetary Health needs real-world evidence. CheckAir transforms citizen voices into actionable health intelligence, helping us understand how pollution impacts respiratory and mental health while guiding better clinical decisions and stronger public policies.
Shane Fitch, CEO Lovexair Foundation
PM2.5 levels linked to respiratory issues, stress and anxiety mental health disorders
From October 16th, 2024 to April 8, 2026, CheckAir collected 1,586 citizen-reports from 32 countries, primarily Spain, Mexico and Argentina, building a Global Respiratory Health Map, representing 46% diagnosed and 54% undiagnosed citizens, spanning diverse age and gender, as part of a global Campaign Clean Air, Healthy Lives supported by more than 60 institutional alliances from scientific, clinical and civic organizations.
This has provided data for a preliminary but relevant analysis of the relationship between air pollution and respiratory health, in different geographic contexts.
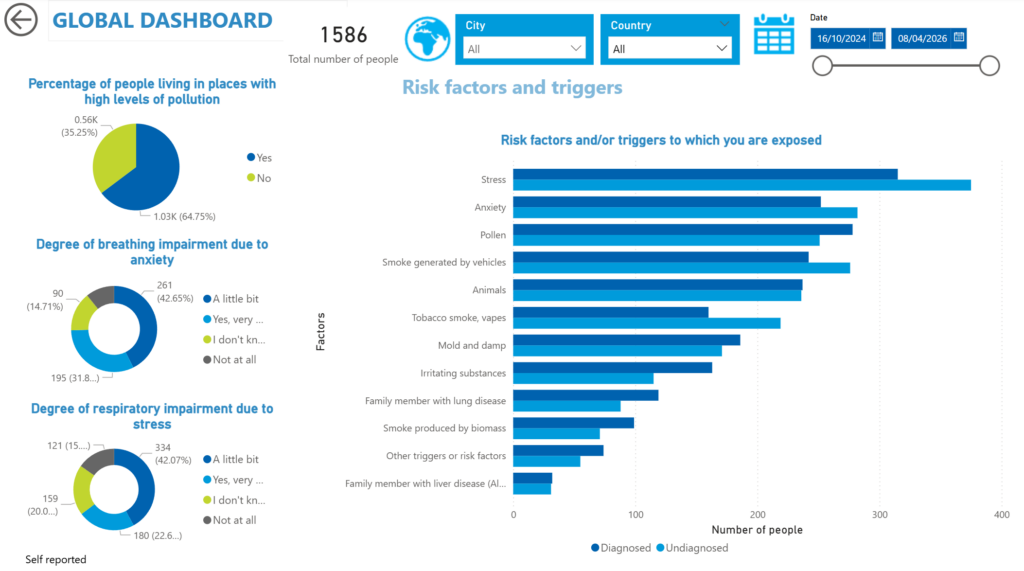
The study found that stress and anxiety were the most reported risk factors among citizens, ranking first and second respectively (Figure 2) — a pattern consistent with evidence linking PM2.5 exposure to mental health deterioration and worsened respiratory outcomes.
The stress and anxiety were also reported as risk factors: of the 39% of respondents who reported anxiety, 74% also experienced breathing impairment. Another 50% reported stress, and among this group 65% reported breathing impairment.
CheckAir allows individuals to explore how air pollution sources — such as vehicle exhaust — may contribute to their personal symptom severity, as visualized in the live map.
| PM2.5 Category µg/m³ | Number of citizens | Percentages % |
| No data | 523 | 32.9 |
| Good (≤5) | 99 | 6.2 |
| Interim Target 4 (5–10) | 457
|
28.8 |
| Interim Target 3 (10–15) | 97 | 6.1 |
| Interim Target 2 (15–25) | 148 | 9.3 |
| Interim Target 1 (25–35) | 237 | 14.9 |
| Unhealthy (>35) | 25 | 1.6 |
| Total citizens | 1586 |
Figure 3 – Number of citizens living in each PM2.5 Category (µg/m³)
Sick without a diagnosis: the hidden respiratory toll of air pollution
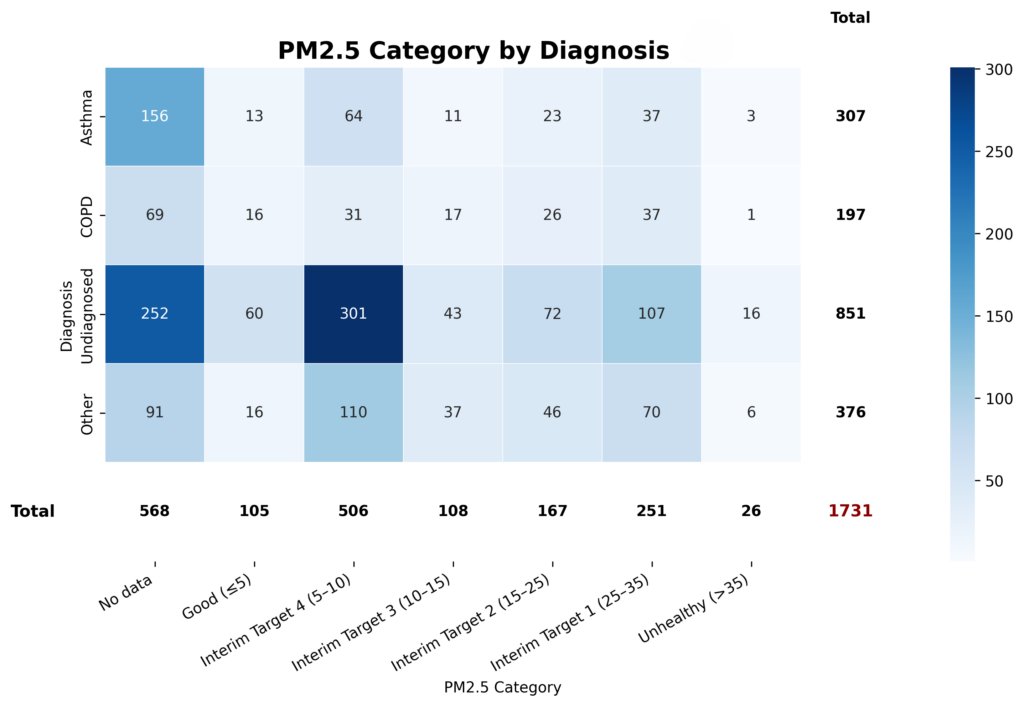
Using annual average PM2.5 values, retrieved from OpenAQ and Lovexair, defined six 2021 WHO standards and thresholds categories [4].
The study found that most people diagnosed were located in areas with levels greater than 5 μg/m³, the WHO’s annual guideline value (Figure 4). Asthma, COPD, and other respiratory conditions clustered in intermediate and moderately high exposure categories. [4-6]
Notably, the undiagnosed group was the largest overall and was also concentrated in categories above the WHO threshold, pointing to a potentially underdiagnosed respiratory burden in polluted environments.
Dyspnoea, or shortness of breath, showed a clear difference by diagnostic status across PM2.5 categories (see Figure 5 and 6). Diagnosed participants consistently reported a higher dyspnoea burden (58.2%) than undiagnosed participants (33.5%), with more than half experiencing some degree of breathlessness in most exposure strata. The greatest burden was observed in IT2 (undiagnosed 44.4%, diagnosed 61.8%), and IT1 (undiagnosed 47.7%, diagnosed 65.4%), and slight-to-very severe dyspnoea was more prominent in IT2 (diagnosed 19.7%) and in IT1 (diagnosed 9.2%).
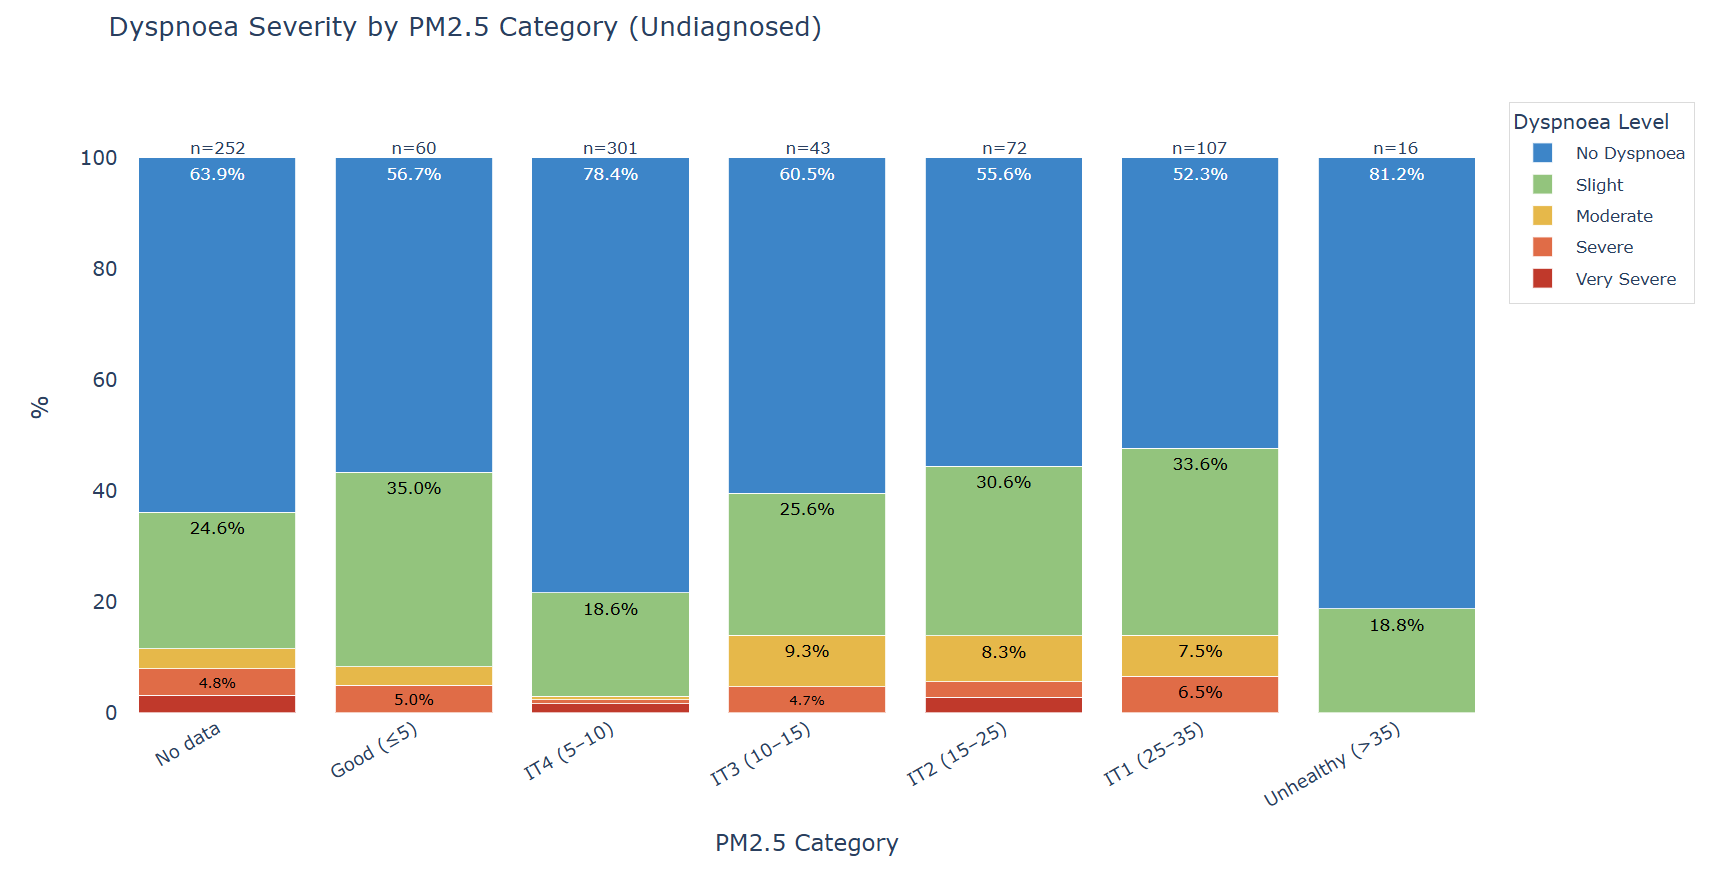
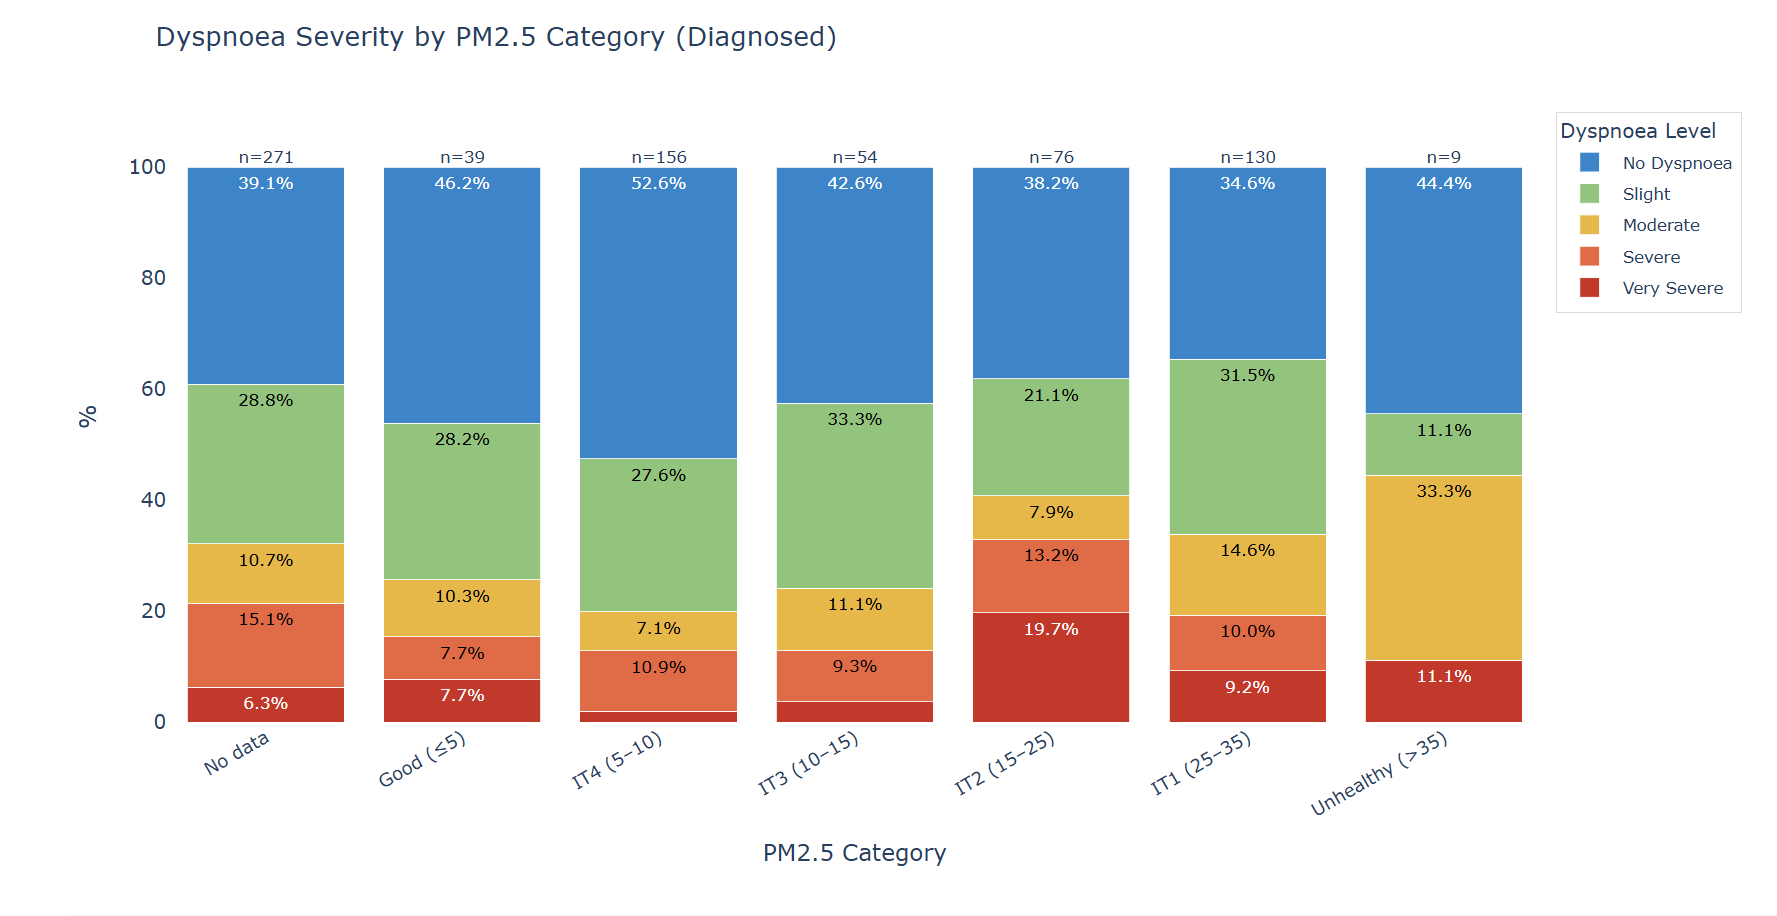
In contrast, among the undiagnosed individuals (n=851), 285 reported a dyspnoea burden, 29.12% located in areas with IT2 or IT1 pollution levels. These findings suggest that PM₂.₅ concentrations above the WHO guidelines may increase dyspnoea burden, particularly among individuals with a prior respiratory diagnosis. However, the highest exposure category should be interpreted with caution due to the limited sample size.
While symptom patterns differed by diagnostic status, a substantial proportion of undiagnosed participants still reported respiratory symptoms across PM2.5 categories (see Figures 7 and 8).
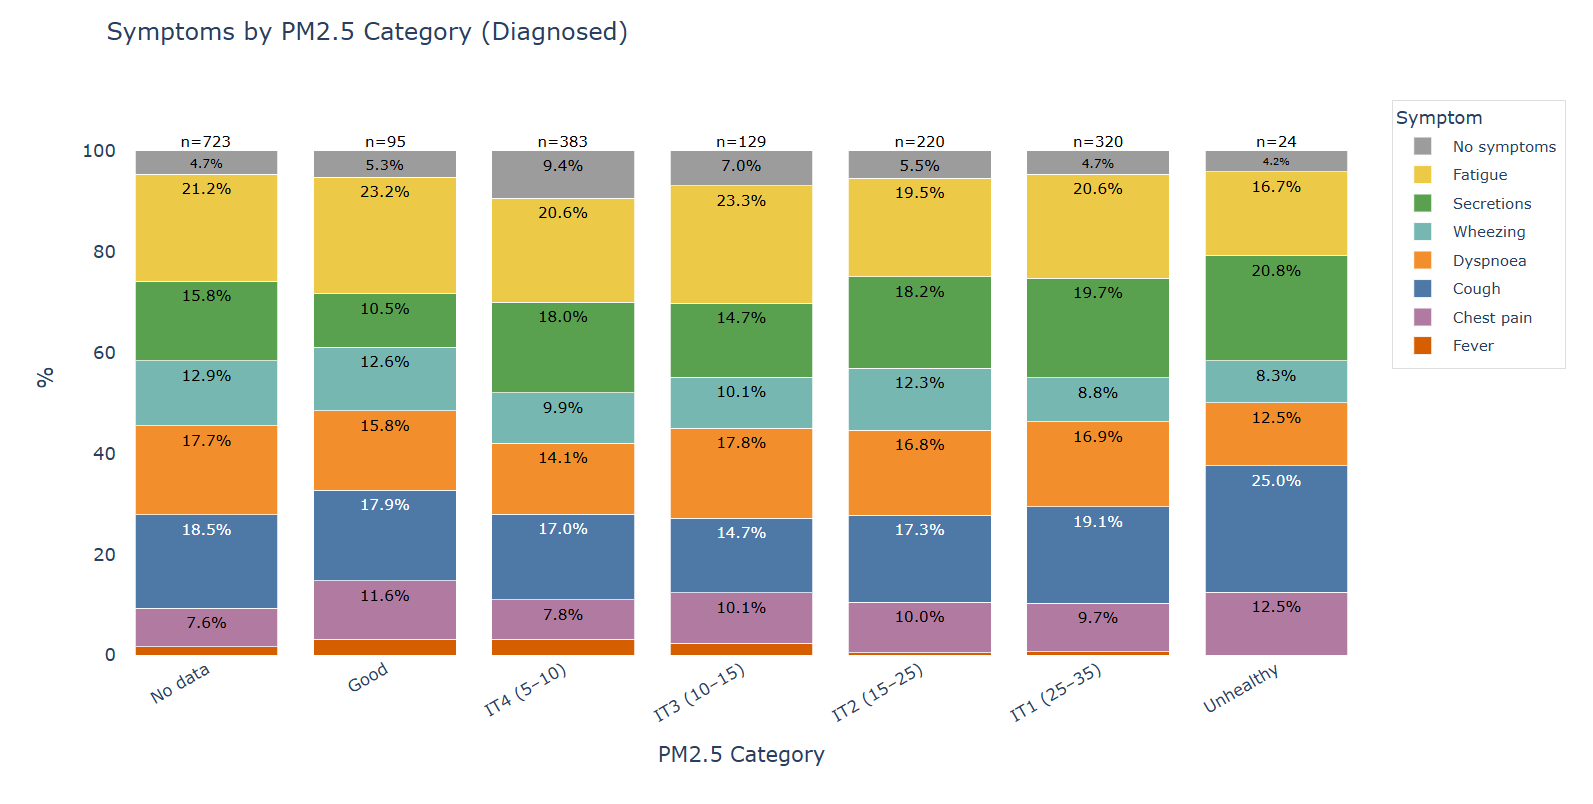
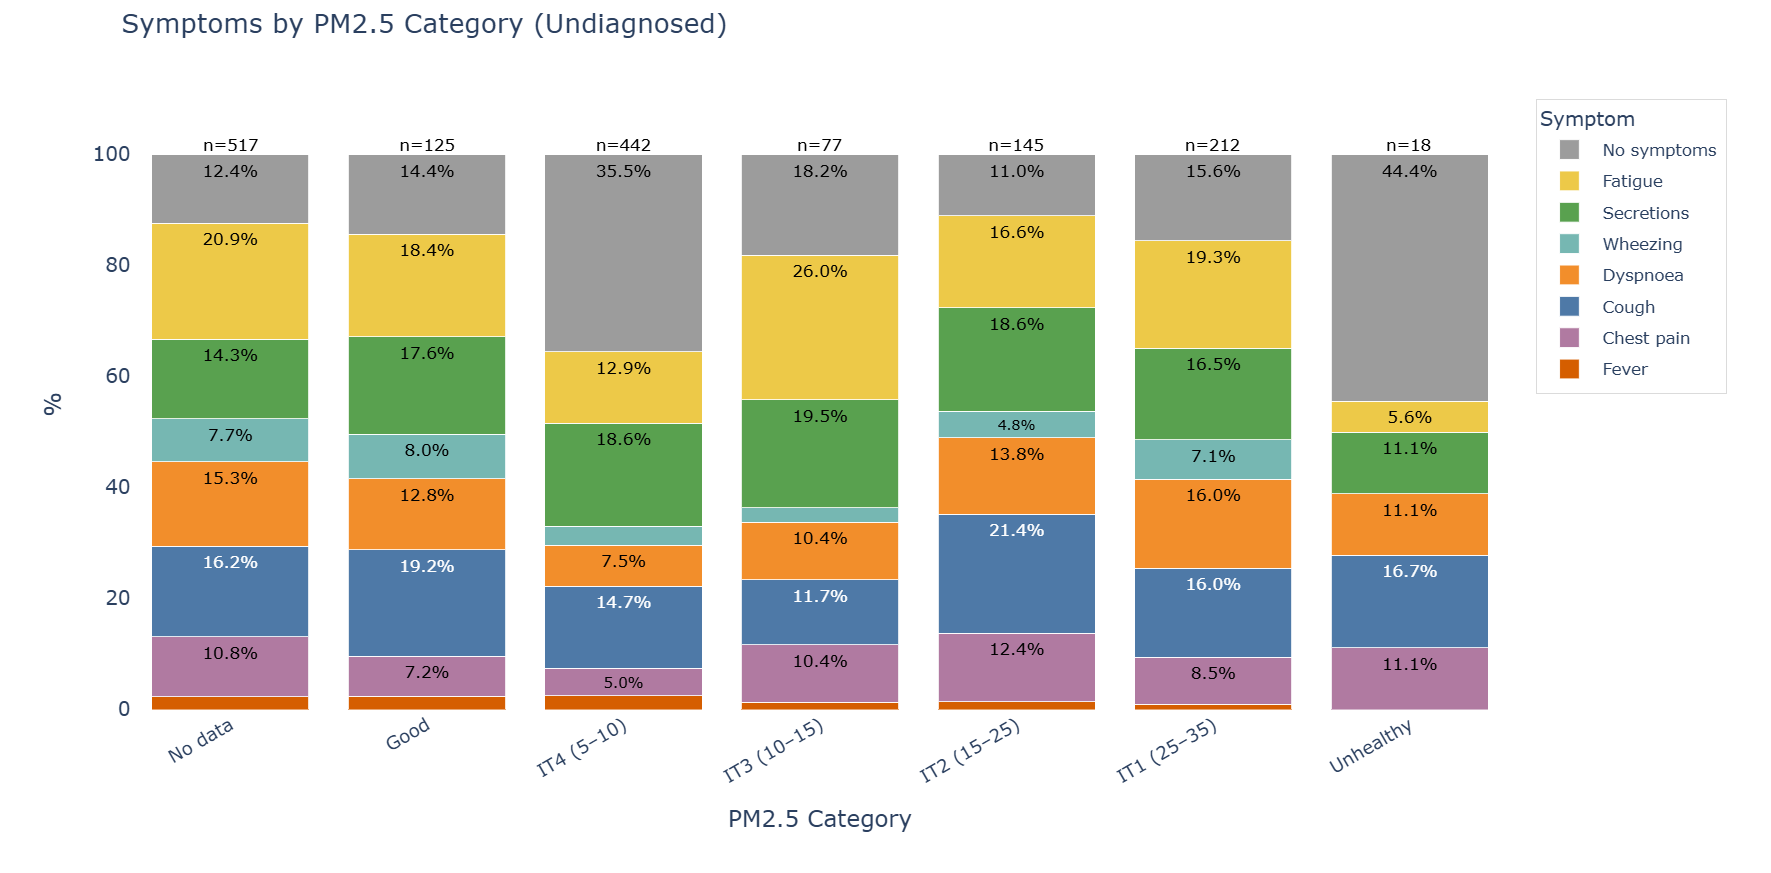
The proportion of respondents reporting no symptoms remained relatively low in several undiagnosed strata, including No data (12.4%), Good (14.4%), IT3 (18.2%), IT2 (11.0%), and IT1 (15.6%), indicating that the majority of these participants were symptomatic despite lacking a prior diagnosis.
Within this undiagnosed group, fatigue, cough, secretions, and dyspnoea were the most frequently reported symptoms, with cough reaching 21.4% in IT2 (15–25 µg/m³), fatigue, peaking at 26.0% in IT3 (10–15 µg/m³), and secretions remaining prominent across several categories.
These findings suggest that respiratory symptom burden is not confined to previously diagnosed individuals and may already be substantial in apparently undiagnosed populations exposed to PM2.5 levels above the WHO annual guideline. Nevertheless, results in the highest exposure category should be interpreted with caution because of the small sample size.
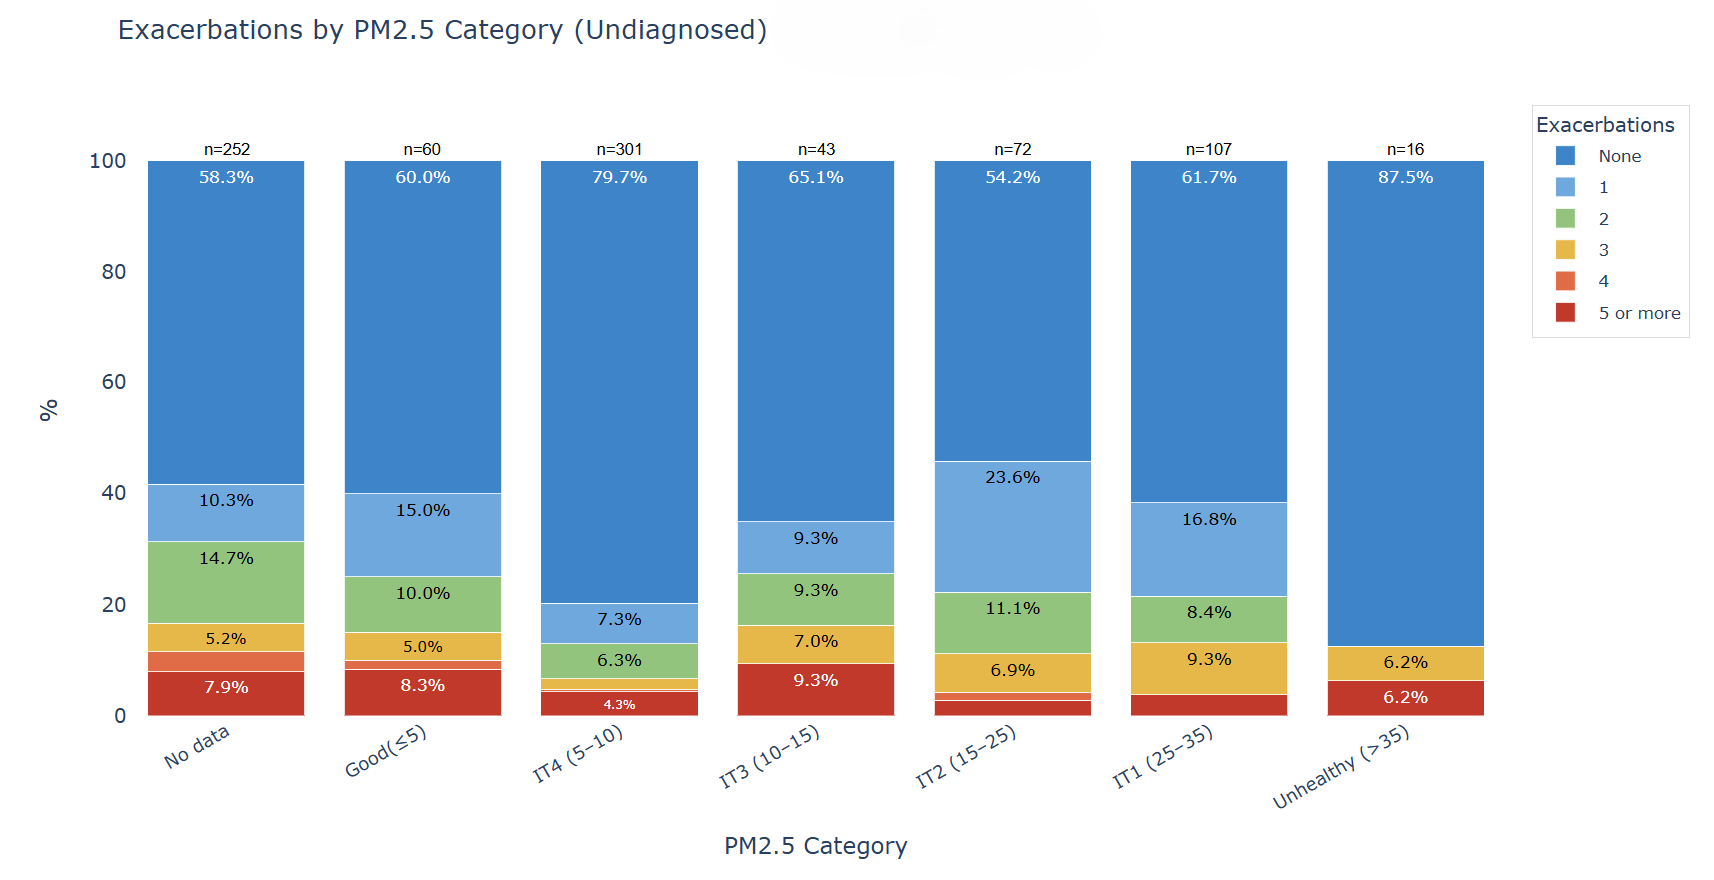
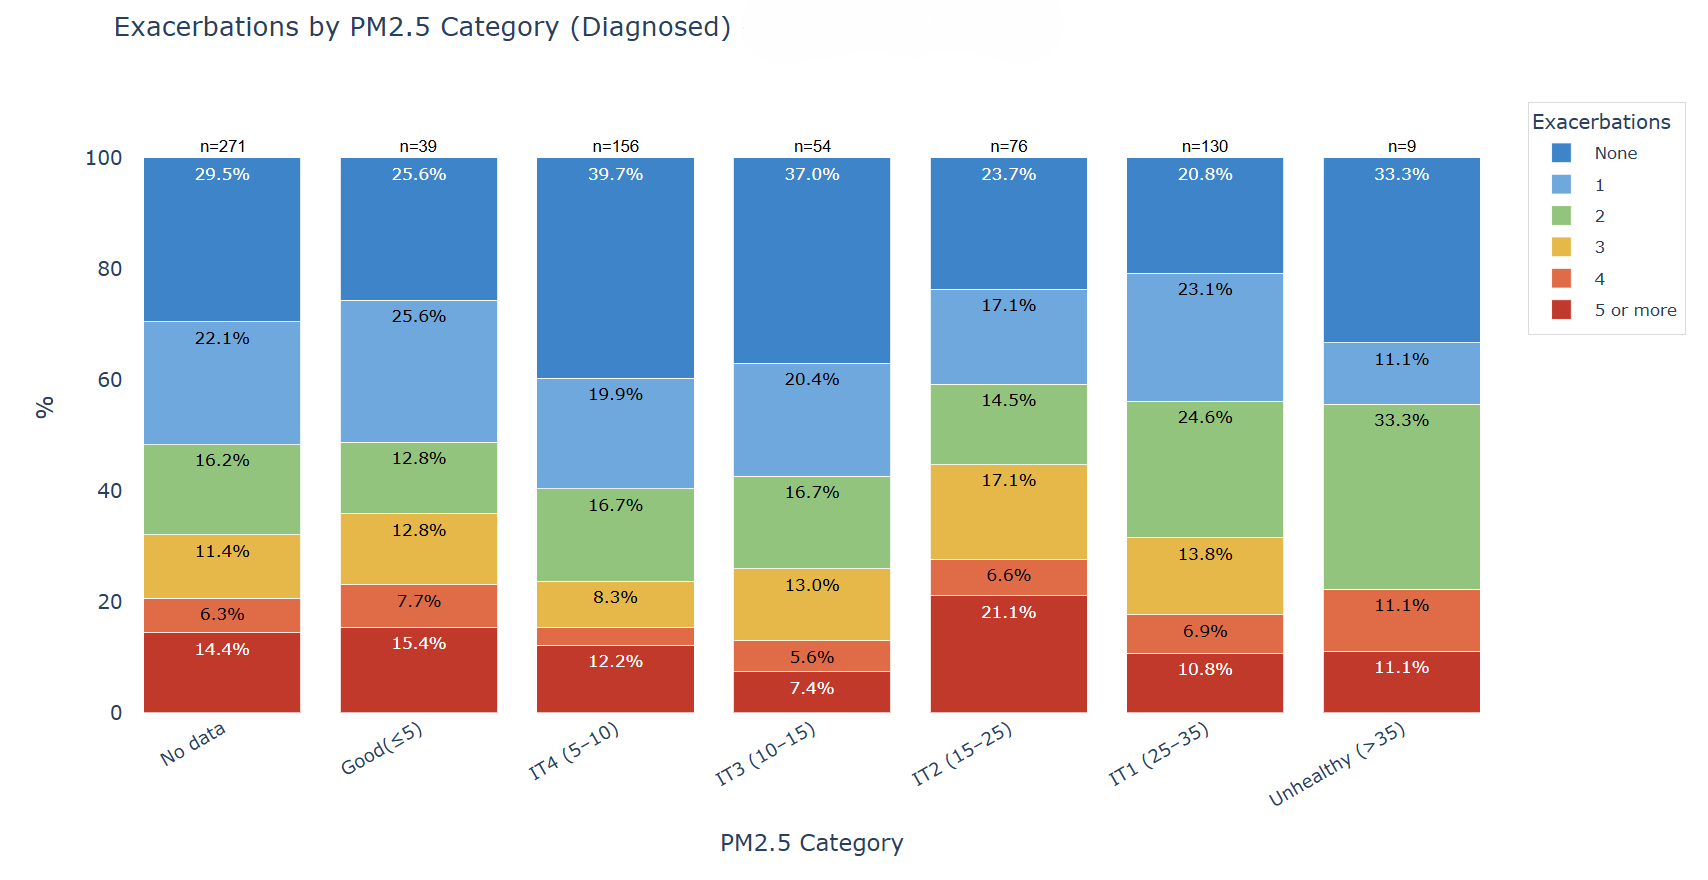
Exacerbation burden was higher in diagnosed than in undiagnosed participants across PM2.5 categories. Nevertheless, among undiagnosed individuals,33% reported at least one exacerbation. This suggests that, although recurrent exacerbations are more common in diagnosed participants, respiratory instability may also be present in undiagnosed populations exposed to PM2.5 above recommended levels (see Figures 9 and 10).
Data limitations
Air quality data availability was limited for some individuals, due to the absence of nearby monitoring stations or because available measurements were outdated. While fixed monitoring stations are generally designed to represent air quality over broader surrounding areas [2], coverage gaps remain in certain locations. As a result, these individuals were grouped into a “No data” category, both to reflect existing data gaps and to highlight the need for improved monitoring coverage and continued advocacy in under-served areas.
Planetary Health requires the practice of health equity, i.e., ensuring that all citizens have access to reliable, high-quality environmental monitoring data and with systems compliant in shared standardization and homogeneity.
Existing gaps in such monitoring reflect structural inequalities that limit the identification of key risk factors, as well as appropriate follow-up and pro-active actions to protect both citizens’ health and their environments.
Recommendations to advance Planetary Health
Because PM2.5 is strongly associated with lung health—and our citizen reports combined with air‑quality data consistently show this—we are committed to pursuing more robust research and reliable, participatory data capture to inform meaningful health actions. Larger datasets are required for more definitive analysis. At the individual level, CheckAir’s personal health profiles, which integrate data on environmental exposures with other primary risk factors, provide exploratory evidence to support clinical care and urban planning, promoting pro-active health management.
Building on these findings, Lovexair aims to develop further solid partnerships, in order scale the CheckAir dataset through a longitudinal study incorporating air quality monitoring and reliable Internet of Things (IoT)-based physiological tracking, to better evaluate respiratory burden progression (symptoms, dyspnoea, exacerbations, stress, anxiety, etc) and broader health impacts.
CheckAir, implemented across multiple settings, demonstrates how digital tools can meaningfully link symptoms, diagnoses, and exacerbations with official air quality data. In a context of climate change and rapid urbanisation, addressing air pollution is a Planetary Health imperative to anticipate risks, protect population health and inform more sustainable public policies.
Significant gaps persist in real‑world episome evidence, which is critical for understanding disease trajectories. CheckAir helps close these gaps by generating large-scale, citizen-led environmental datasets enriched by real-world health and wellbeing reporting.
Powered by advanced analytics and AI, this approach can strengthen prevention, optimise care pathways, and equip health systems with the precise, evidence-based insights needed for more effective decision-making in the Planetary Health approach.
Methods
CheckAir is a scalable, digital health assessment tool, currently available in 3 languages (English, Spanish and Portuguese) which helps citizens understand how pollution and other risk factors affect their respiratory health. It’s open to all individuals — from those living with COPD or asthma or rare disease, to citizens exposed to pollution, wildfires, or occupational exposures.
The data collected — within the framework of the Lovexair campaign “Clean Air, Healthy Lives”, supported by more than 60 organizations — helps design targeted actions to better protect vulnerable groups, and each participant receives a personalized report and a lung health guide with practical self-care recommendations.
With the results gathered through CheckAir, Lovexair is building a Global Respiratory Health Map with the aim of uncovering unmet health needs that traditional surveillance often overlooks.
References
[1] World Health Organization: WHO. (2022). Billions of people still breathe unhealthy air: new WHO data.
[2] Kracht, O. et al. (2018). Spatial representativeness of air quality monitoring sites: outcomes of the FAIRMODE/AQUILA intercomparison exercise. Luxembourg: Publications Office of the European Union.
[3] OpenAQ (2023). About the OpenAQ API.
[4] World Health Organization (2021) WHO global air quality guidelines: particulate matter (PM2.5 and PM10), ozone, nitrogen dioxide, sulfur dioxide and carbon monoxide. Geneva: World Health Organization.
[5] Zhang, X., Liu, Y., Wang, S., Chen, R. and Li, T. (2024). Ambient particulate matter exposure and chronic obstructive pulmonary disease: epidemiological and mechanistic evidence. The Lancet Planetary Health, 8(10), e487–e498.
[6] Xing, M., Cui, F., Zheng, L., Ma, Y., Wang, J., Tang, L., Chen, N., Zhao, X., Tian, Y.and Su, B. (2025). Association of fine particulate matter constituents with chronic obstructive pulmonary disease and the effect modification of genetic susceptibility. npj Climate and Atmospheric Science, 8, Article 89.
[7] Dong, Y., Yue, H., Hu, M., Li, Y., Liu, T. and Wang, J. (2025). The effect of ambient particulate matter on chronic obstructive pulmonary disease: an overview. Interventional Pulmonology, 1(1), pp.20–33.
Contributions and research panel
Lovexair Foundation acknowledges the contributions of Eva Maroto, Besan Abusalah, Mustafa Abusalah, Andrea Gonzales, Shane Fitch and Leonor Pérez to this article, as part of Lovexair team. Also, special thanks to the experts and researchers panel integrated by:
Ivonne Torres
Specialist in preventive medicine and public health
Francisco Javier Sánchez Iñigo, PhD
Air Pollution Area, National Center for Environmental Health, Instituto de Salud Carlos III
Felipe Villar
Associate Head of the Pulmonology Department at Fundación Jiménez Díaz University Hospital (Madrid, Spain)
Sotirios Papathanasiou
Founder and CEO at GO AQS (Global Open Air Quality Standards)
Vickram Tejwani, M.D.
Department of Pulmonary and Critical Care Medicine, Integrated Hospital Care Institute, Cleveland Clinic, Cleveland, OH, USA.
Genomic Sciences and Systems Biology, Cleveland Clinic Research, Cleveland Clinic, Cleveland, OH, USA.
Read Related Article :